A scalable framework for quantifying field-level agricultural carbon outcomes
(《量化田间农业碳排放结果的可扩展框架》)
期刊:Earth-Science Reviews
2021年影响因子:12.038
5年影响因子:14.424
在线发表时间:2023.05.29
第一作者:管开宇副教授
第一单位:美国伊利诺伊大学厄巴纳-香槟分校/可持续发展、能源和环境研究所/农业生态系统可持续发展中心
研究背景Research background
农业贡献了全球近四分之一的温室气体排放(GHG),这激发了人们对采用某些有可能减少温室气体排放或在土壤中固碳的农业实践方法的兴趣。相关的GHG排放(包括N2O和CH4)和土壤碳储量的变化在这里被定义为“农业碳结果(agricultural carbon outcomes)”。农业碳结果的准确量化是实现农业减排的基础,但现有的碳结果测量方法(包括直接测量、排放因子、基于过程的建模)未能达到支持可信(credible)、可验证(verifiable)和成本效益高的(cost-effective)碳结果的测量和改进所需的准确性和可扩展性(scalability)。

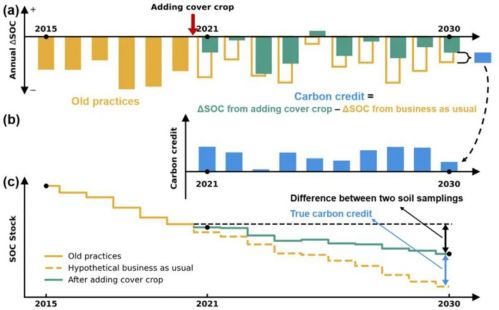
Illustration of the “additionality" concept for agricultural carbon credit, using ahypothetical corn-soybean rotation field in the U.S. Midwest as an example,assuming cover cropping is newly adopted in 2021 with a ten-year commitment.(a) Annual change in the SOC stock (i.e. ASOC) since 2015, with hypotheticalscenarios from 2021 to 2030.(b) Generated annual carbon credit from 2021 to2030.(c) Change in SOC stock over time.
研究内容Research contents
在这里,作者提出了一个基础和可扩展的框架,以量化农田的田间碳结果,该框架基于农业生态系统的整体碳平衡:农业生态系统碳结果 = 环境(E) × 管理(M) × 作物(C)。
在全面审阅了与现有方法相关的科学挑战以及它们在成本和准确性之间的权衡之后,作者提出,量化农田田间碳结果的最可行途径是有效整合各种方法(例如,不同的观测、传感器/现场数据、建模),定义为“系统体系(system-of-systems)”解决方案。
这种“系统体系”解决方案应同时包括以下组成部分:(1)可扩展地(scaleable)收集地面实况数据,并在当地实地对环境变量(E)、管理做法(M)和作物状况(C)进行跨尺度传感;(2) 具有必要过程的高级建模,以支持碳结果的量化;(3)系统的模型数据融合(Model-Data Fusion,MDF),即在每个地方农田级别集成传感数据和模型的稳健有效的方法;(4)高计算效率和人工智能(AI),以低成本扩展到数百万个单独的实地农田;以及(5)稳健的多层验证系统和基础设施,以确保解决方案的准确性(fidelity)和真正的可扩展性,即解决方案在所有目标领域以公认的准确性稳健执行的能力。
在这方面,作者在本文中提供了详细的科学原理、当前进展和未来研发(R&D)优先事项,以实现“系统体系”解决方案的不同组成部分,从而实现环境×管理×作物框架,以量化田间级农业碳结果。
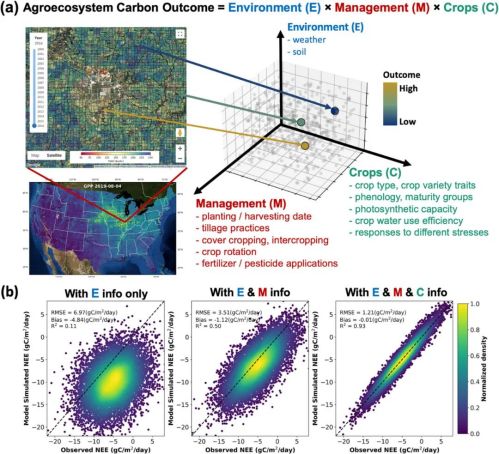
Fig. 1. Conceptual diagram of quantifying agroecosystem carbon outcomes at the fieldlevel for agroecosystems.(a) Agricultural carbon outcome is determined by three factors.i.e. environment condition (E), management practices (M), and crop condition (C), as welas their interactions.(b) Accuracy of the quantification methods improves significantly asmore information is constrained at the field level. The example shown here focuses onquantifying net ecosystem exchange (NEE), which is the net CO exchange between landand atmosphere that can be measured directly with the eddy-covariance flux tower sitesin the U.S. Midwest (Zhou et al, 2021); the three scenarios refer to: (left) only using Einformation (i.e. weather and soil) as input in the carbon outcome quantification,center) using both M (i.e. field-level management practices) and E information for thecarbon outcome quantification, and (right) using C (i.e. photosynthesis, yield, leaf areaindex), M, E information together to drive or constrain the model.
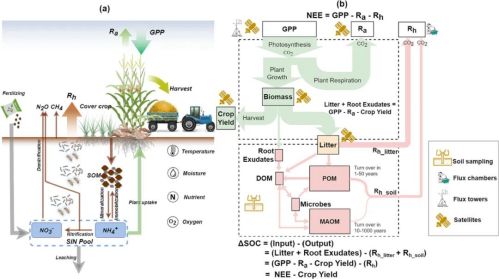
Fig. 2. The holistic carbon and nitrogen balance and its linkage with greenhouse gasemissions over annual row cropping farmland(a) and a mass balance based approach toquantify the change of soil organic carbon (SOC)(b). GPP: gross primary productivity;Ra:autotrophic respiration; Rh: heterotrophic respiration; NEE: net ecosystem exchange:DOM: dissolved organic matter; POM: particulate organic matter; MAOM: mineral-associated organic matter.
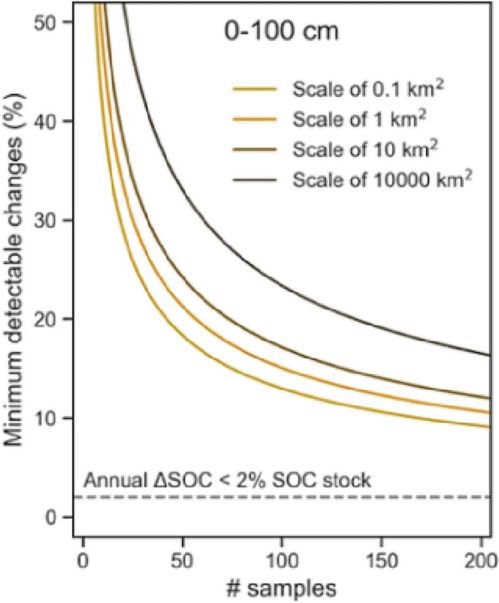
Fig. 3. Soil sampling accuracy (i.e. minimum detectable change, in terms of relativechange in the SOC stock) as a function of the number of soil samples and field sizeswhich is much larger than the annual change of SOC stock in reality (Maillard et al.,2017).
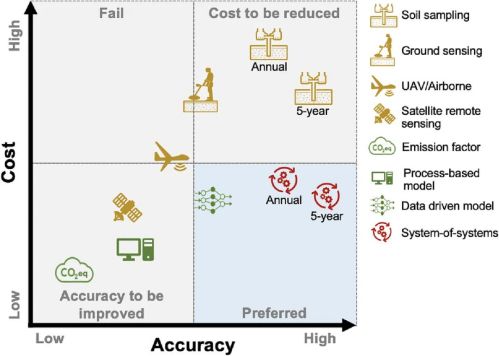
Fig. 4. Qualitative illustration of how different technological solutions for quantifyingfield-level carbon outcomes fit in the accuracy and cost diagram. The relative positions ofdifferent solutions are mainly based on the technical review by ARPA-E (DOE ARPA-E:DE-FOA-0002250, 2020) and literature (e.g. Paustian et al., 2019; Smith et al., 2020).
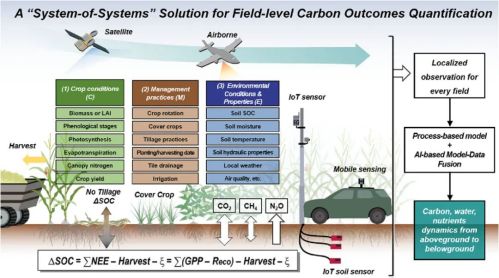
Fig. 5. Illustration of a "System-of-Systems" solution for quantifying field-level carbonoutcome, including above and belowground processes. The "System-of-Systems" solutionincludes sensing, monitoring, modeling, and model-data fusion, targeting to assure field-level accuracy, scalability, and cost-effectiveness. ξ represents carbon loss from varioussources, which is usually very small (<0.5%) and thus can be neglected in most cases.
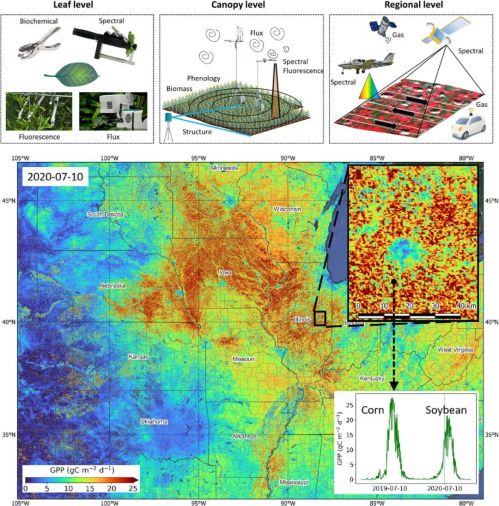
Fig. 6. Cross-scale sensing to generate photosynthesis information at the field level. (Top)The cross-scale sensing from leaf to canopy, and to regional levels for estimatingphotosynthesis.(Bottom) A snapshot of field-level estimation of photosynthesis on 07-10-2020, derived from the large-scale SLOPE photosynthesis data at daily frequency(Jiang et al., 2021), showing field-level Champaign County pattern and a field-level dailytime series of photosynthesis.
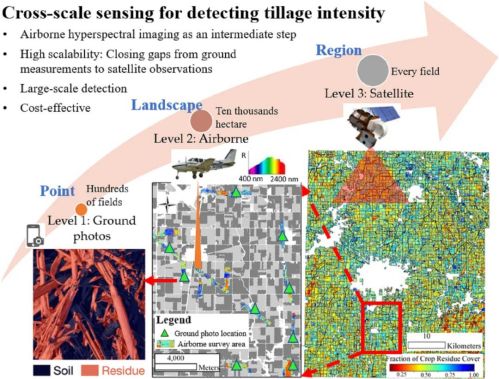
Fig. 7. Cross-scale sensing to quantify regional high-resolution tillage intensity (Wang etal., 2023a, Wang et al., 2023b). Ground truth of crop residue cover was obtained throughground photos and computer vision-aided image segmentation. Then, airbornehyperspectral imaging along with machine learning was applied to upscale ground pointmeasurements to landscape scale. Finally, massive airborne hyperspectral survey derivedresidue cover data were integrated with multi-source satellite fusion data to deriveregional information of residue cover and tillage intensity.
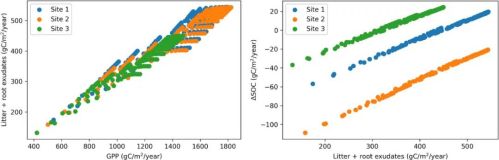
Fig. 8. GPP is closely linked with soil carbon input, i.e. litter and root exudates, and thusdirectly affect change of SOC(Grant, 2001).This site-level sensitivity analysis isconducted over three sites with different environmental and soil conditions in northern(Site 1), central(Site 2) and southern (Site 3) illinois using the ecosys model (Zhou et al.2022a, Zhou et al. 2022b).
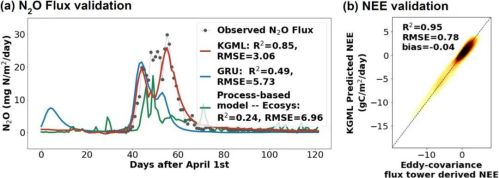
Fig. 9. N2O and CO2 fluxes estimated by two KGML models.(a) KGML outperforms theprocess-based model and pure ML model in simulating N2O fluxes. (b) KGML predictednet ecosystem exchange (NEE) demonstrated great agreement with observations from 1eddy-covariance flux towers in the U.S. Midwest. Validations of KGML were carried outon a dataset that was not used in its training process.
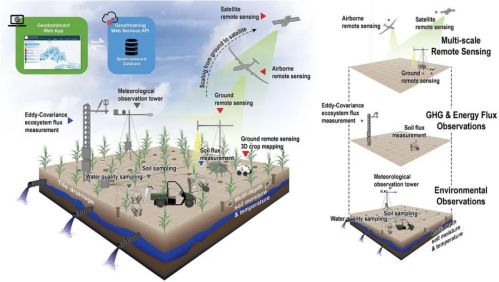
Fig. 10. Example of the Tier 1 super site: using the ARPA-E SMARTFARM Phase 1 site atChampaign, Illinois, managed by University of illinois Urbana Champaign.
原文链接:
https://www.sciencedirect.com/science/article/pii/S0012825223001514


 电话:
电话: