Tian Hanqin*, Xu Rongting, Canadell Josep, Thompson Rona, Winiwarter Wilfried, Suntharalingam Parvadha, Davidson Eric, Ciais Philippe, Jackson Robert, Janssens-Maenhout Greet, Prather Michael, Régnier Pierre, Pan Naiqing, Pan Shufen, Peters Glen, Shi Hao, Tubiello Francesco, Zaehle Sönke, Zhou Feng, Arneth Almut, Battaglia Gianna, Berthet Sarah, Bopp Laurent, Bouwman Alexander, Buitenhuis Erik, Chang Jinfeng, Chipperfield Martyn, Dangal Shree, Dlugokencky Edward, Elkins James, Eyre Bradley, Fu Bojie, Hall Bradley, Ito Akihiko, Joos Fortunat, Krummel Paul, Landolfi Angela, Laruelle Goulven, Lauerwald Ronny, Li Wei, Lienert Sebastian, Maavara Taylor, MacLeod Michael, Millet Dylan, Olin Stefan, Patra Prabir, Prinn Ronald, Raymond Peter, Ruiz Daniel, Van Der Werf Guido, Vuichard Nicolas, Wang Junjie, Weiss Ray, Wells Kelley, Wilson Chris, Yang Jia, Yao Yuanzhi. A comprehensive quantification of global nitrous oxide sources and sinks. Nature, 2020, 586(7828): 248-256. DOI: 10.1038/s41586-020-2780-0
摘 要:氧化亚氮(N2O)和二氧化碳一样,是一种在大气中长期存在的温室气体。在过去150年里,大气中N2O浓度的增加导致平流层臭氧消耗和气候变化,目前以每十年2%的速率增长。现有的国家清单没有提供N2O排放的全面情况,因为它们忽略了自然来源,并且在确定人为来源的方法上存在一定的局限性。在此,本研究提出了一个全球N2O清单,其中包括自然和人为来源,并说明了氮添加与控制N2O排放生物化学过程之间的相互作用。本研究使用自下而上(清单;测定通量的统计外推;基于过程的陆地和海洋建模)和自上而下(大气反演)的方法,对1980年至2016年间21个自然和人类部门之间产生的全球N2O源和汇进行了综合量化。2007年至2016年间,全球N2O排放量为每年17(最小-最大估算值:12.2~23.5)Tg N(自下而上方法)和每年16.9(15.9~17.7)Tg N(自上而下方法)。在过去的四十年里,以向农田施氮为主的全球人为排放增加了30%,达到每年增长7.3(4.2~11.4)Tg N,这种增加是大气氮负荷增加的主要原因。本研究发现表明,新兴经济体(尤其是巴西、中国和印度)的N2O排放量正在增加。基于过程的模型估算结果揭示了一种新出现的N2O-气候反馈,而这种反馈是由氮添加和气候变化之间的相互作用产生的。最近N2O排放量的增长超过了一些最高的预测排放情景,这凸显了减少N2O排放的紧迫性。
Abstract: Nitrous oxide (N2O), like carbon dioxide, is a long-lived greenhouse gas that accumulates in the atmosphere. Over the past 150 years, increasing atmospheric N2O concentrations have contributed to stratospheric ozone depletion and climate change, with the current rate of increase estimated at 2 per cent per decade. Existing national inventories do not provide a full picture of N2O emissions, owing to their omission of natural sources and limitations in methodology for attributing anthropogenic sources. Here we present a global N2O inventory that incorporates both natural and anthropogenic sources and accounts for the interaction between nitrogen additions and the biochemical processes that control N2O emissions. We use bottom-up (inventory, statistical extrapolation of flux measurements, process-based land and ocean modelling) and top-down (atmospheric inversion) approaches to provide a comprehensive quantification of global N2O sources and sinks resulting from 21 natural and human sectors between 1980 and 2016. Global N2O emissions were 17.0 (minimum–maximum estimates: 12.2–23.5) teragrams of nitrogen per year (bottom-up) and 16.9 (15.9–17.7) teragrams of nitrogen per year (top-down) between 2007 and 2016. Global human-induced emissions, which are dominated by nitrogen additions to croplands, increased by 30% over the past four decades to 7.3 (4.2–11.4) teragrams of nitrogen per year. This increase was mainly responsible for the growth in the atmospheric burden. Our findings point to growing N2O emissions in emerging economies—particularly Brazil, China and India. Analysis of process-based model estimates reveals an emerging N2O–climate feedback resulting from interactions between nitrogen additions and climate change. The recent growth in N2O emissions exceeds some of the highest projected emission scenarios, underscoring the urgency to mitigate N2O emissions.
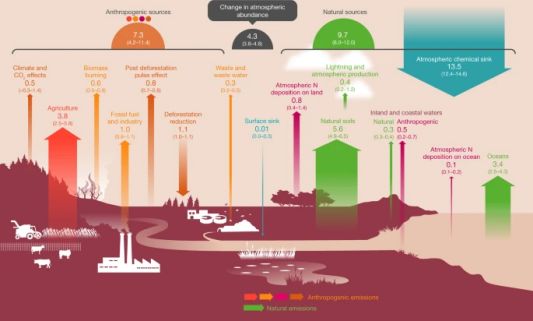
图1 2007-2016 年全球N2O收支
Fig. 1 Global N2O budget for 2007–2016. The coloured arrows represent N2O fluxes (in Tg N yr−1 for 2007–2016) as follows: red, direct emissions from nitrogen additions in the agricultural sector (agriculture); orange, emissions from other direct anthropogenic sources; maroon, indirect emissions from anthropogenic nitrogen additions; brown, perturbed fluxes from changes in climate, CO2 or land cover; green, emissions from natural sources. The anthropogenic and natural N2O sources are derived from bottom-up estimates. The blue arrows represent the surface sink and the observed atmospheric chemical sink, of which about 1% occurs in the troposphere. The total budget (sources + sinks) does not exactly match the observed atmospheric accumulation, because each of the terms has been derived independently and we do not force top-down agreement by rescaling the terms. This imbalance readily falls within the overall uncertainty in closing the N2O budget, as reflected in each of the terms. The N2O sources and sinks are given in Tg N yr−1. Copyright the Global Carbon Project.
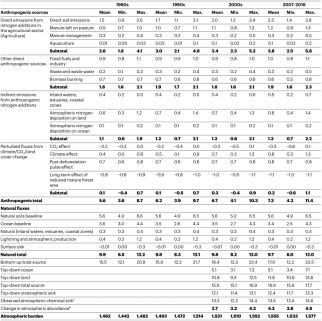
Bottom-up estimates include four categories of anthropogenic source and one category for natural sources and sinks. The sources and sinks of N2O are given in Tg N yr−1. The atmospheric burden is given in Tg N.
a Calculated from satellite observations with a photolysis model (about 1% of this sink occurs in the troposphere).
b Calculated from the combined NOAA and AGAGE record of surface N2O, and adopting the uncertainty of the IPCC Assessment Report 5 (Chapter 6). Detailed information on calculating each sub-category is shown in Supplementary Tables 1–13.
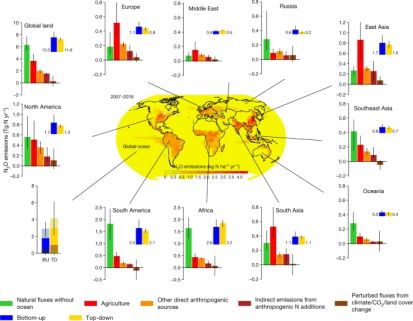
图2 2007-2016十年间的区域 N2O 来源
Fig. 2 Regional N2O sources in the decade 2007–2016. The Earth’s ice-free land is partitioned into ten regions: North America, South America, Europe, Middle East, Africa, Russia, East Asia, South Asia, Southeast Asia and Oceania. Each subplot shows the emissions from five sub-sectors using bottom-up approaches, followed by the sum of these five categories using bottom-up approaches (blue) and the estimates from top-down approaches (yellow). Bottom-up and top-down estimates of ocean emissions are shown at the bottom left (from bottom to top, lighter to darker, the contributions from the 30°–90° N, 30° S–30° N and 90°–30° S regions). Error bars indicate the spread between the minimum and the maximum values. The centre map shows the spatial distribution of 10-year average N2O emissions from land and ocean based on the land and ocean models. Per capita N2O emission (kg N per capita per year) during 2007–2016 is shown in Supplementary Fig. 2. The map was created using ESRI ArcMap 10.4.1.
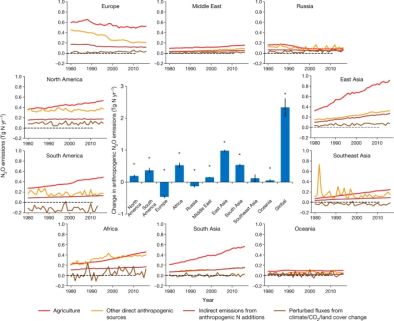
图 3 1980-2016 年期间区域人为 N2O 排放
Fig. 3 Ensembles of regional anthropogenic N2O emissions over the period 1980–2016. The bar chart in the centre shows the accumulated changes in regional and global N2O emissions during the study period of 1980–2016. Error bars indicate the 95% confidence interval for the average of accumulated changes. The Mann–Kendall test was performed to examine a monotonic increasing or decreasing trend in the estimated ensemble N2O emissions globally and for each region over the period 1980–2016. The accumulated changes were calculated from the linear regressed annual change rate (Tg N yr−2) multiplied by 37 years. All regions except Southeast Asia show a significant increasing or decreasing trend in the estimated ensemble N2O emissions during the study period . *P < 0.05.
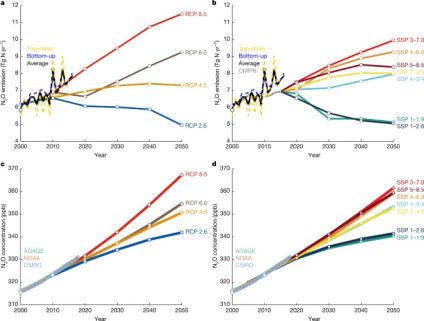
图 4 历史和预测的全球人为 N2O 排放和浓度
Fig. 4 Historical and projected global anthropogenic N2O emissions and concentrations. a–d, Global anthropogenic N2O emissions (a, b) and concentrations (c, d) compared to the four RCPs in the IPCC assessment report 5 (a, c; ref. 2) and the new marker scenarios based on the SSPs used in CMIP6 (b, d; ref. 48). The historical emissions data are represented as the mean of the bottom-up and top-down estimates of anthropogenic N2O emissions, whereas the historical atmospheric concentration data are from the three available observation networks: AGAGE, NOAA, and CSIRO. Top-down anthropogenic emissions were calculated by subtracting natural fluxes derived from bottom-up approaches. To aid the comparison, the four RCPs were shifted down so that the 2005 value is equal to the 2000–2009 average of the mean of top-down and bottom-up estimates. The SSPs are harmonized3 to match the historical emissions used in CMIP649; Extended Data Fig. 10 shows the unharmonized data.


 电话:
电话: